IEEE IC3ECSBHI 2026 · February 12–14, 2026

Real-Time Multi-Modal Sensor for Field-Based Microplastic Detection

GangaDrishthi is a compact, low-cost platform that fuses impedance spectroscopy, programmable multispectral optical imaging, and YOLOv8 deep-learning microscopy to deliver laboratory-grade microplastic detection directly in the field — at a fraction of the cost.
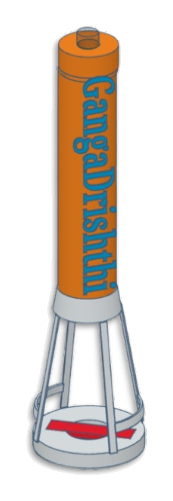
3D model of the GangaDrishthi field sensor buoy
<200msInference / sample
3Fused sensing modalities
5mmParticle threshold
5+Polymer classes
01 — Abstract

The microplastic problem, reimagined for the field

Microplastic pollution has emerged as one of the most concerning environmental issues of our time — minute plastic fragments smaller than 5 mm are now detected in oceans, freshwater systems, and even human tissue. Established detection methods such as FTIR and Raman spectroscopy are accurate but laboratory-bound, expensive, and too slow for real-time field monitoring.

GangaDrishthi integrates impedance sensing, programmable multispectral optical sensing, and machine-learning-augmented microscopy for rapid on-site microplastic quantification. Using a YOLOv8-based deep-learning pipeline, the system automatically identifies particle size and estimates polymer type in water samples. Results surface through a companion app that generates geo-tagged contamination heatmaps and a Microplastic Risk Index (MRI). Validated against standard FTIR/Raman data, it delivers laboratory-grade accuracy — empowering researchers and citizen scientists alike.

  • Microplastic detection
  • YOLOv8
  • Deep learning
  • Impedance spectroscopy
  • Multispectral imaging
  • IoT sensors
  • Environmental monitoring
Why it matters

From centralized labs to a distributed sensing network

Moving environmental surveillance away from costly central laboratories toward an accessible, portable network makes large-scale tracking simpler and response faster.

Real-time & on-device

Quantized ML models run at the edge on an ESP32-S3, delivering inference in under 200 ms per sample — no lab, no waiting.

Low-cost & portable

Designed for minimal-power field operation with small microcontrollers, deployable even in resource-limited areas.

Geo-tagged intelligence

A companion app maps contamination hotspots and computes a Microplastic Risk Index to guide policy and action.

Lab-grade accuracy

Multimodal fusion validated against FTIR / Raman benchmarks for reliable polymer identification and sizing.

02 — System Design

Three sensing modalities, one pipeline

A multimodal, field-deployable analytical platform for detection, classification, and risk assessment — fused by a machine-learning model and streamed to the cloud.

01

Multispectral Optical Imaging

A programmable LED array sweeps 400–940 nm, capturing polymer-specific absorption and reflectance signatures through band-depth and intensity-ratio features.

02

Impedance Spectroscopy

Microfluidic electrodes record complex impedance |Z(f)| and phase across 1 kHz–2 MHz, capturing the distinct dielectric response of each polymer.

03

Microscopy Imaging

A 500× digital microscope yields high-resolution RGB particle images; segmentation extracts diameter, aspect ratio, circularity, and texture descriptors.
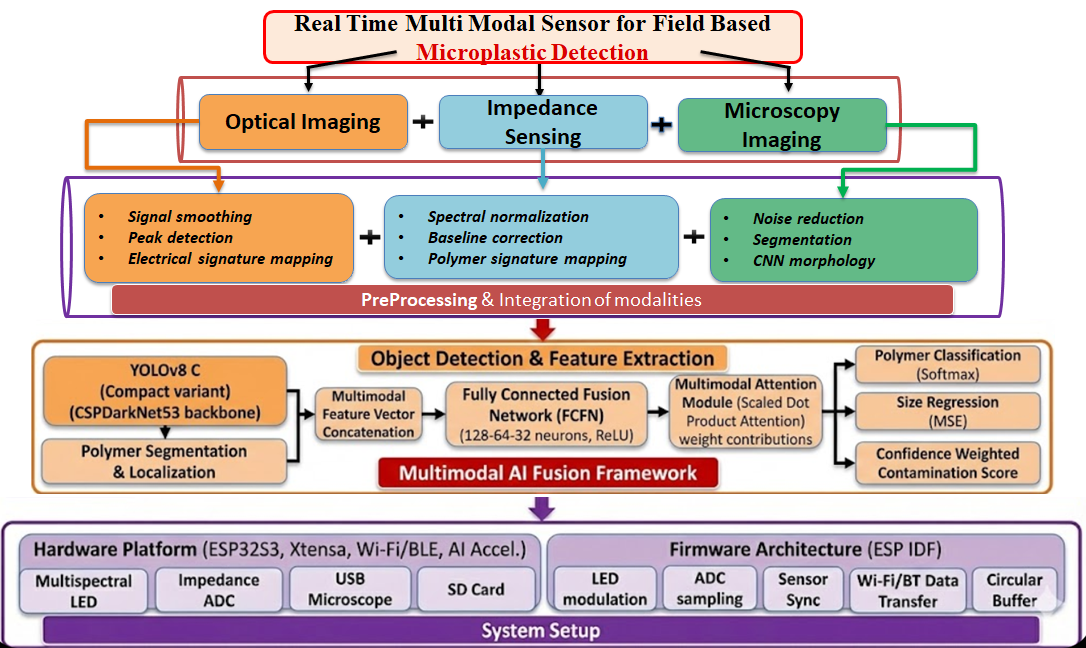
GangaDrishthi system architecture: optical imaging, impedance sensing and microscopy imaging feed preprocessing and a multimodal AI fusion framework on an ESP32-S3 platform.
Fig. 1 — System architecture: the three sensing modalities feed preprocessing and a YOLOv8-driven multimodal AI fusion framework, deployed on an ESP32-S3 hardware/firmware stack.

Multimodal AI fusion

Feature vectors from YOLOv8 visual embeddings, impedance dielectric profiles, and optical reflectance patterns are concatenated and passed through a Fully Connected Fusion Network (FCFN) — a three-layer dense network (128–64–32, ReLU) optimized with Adam.

A scaled dot-product attention module adaptively weighs each modality's contribution, producing polymer classification (softmax), size regression, and a confidence-weighted contamination score.

CSPDarkNet53 backbone Anchor-free heads Attention fusion 8-bit TFLite quantization

Hardware platform

  • ControllerESP32-S3 · dual-core Xtensa · Wi-Fi/BLE
  • IlluminationMultispectral LED driver (I²C)
  • ImpedanceADC-based acquisition circuit
  • ImagingUSB UVC microscope camera
  • StorageSD-card module · circular buffer
  • FirmwareESP-IDF framework
03 — Methodology

How a water sample becomes a risk score

  1. 1

    Sample handling

    An optically transparent microfluidic flow cell draws water into laminar flow, aligning optical, electrical, and microscopic views into a single sensing region.

  2. 2

    Signal acquisition

    Optical, impedance, and microscopy streams are timestamp-coordinated by the ESP32-S3 and combined into a single event record.

  3. 3

    Preprocessing

    Gaussian denoising and watershed segmentation for imaging; Savitzky–Golay smoothing and PCA for impedance; Z-score / Min–Max feature normalization across modalities.

  4. 4

    Detection & fusion

    YOLOv8-C localizes and segments particles across PET, PP, PE, PS, and PVC classes; fused features drive classification, sizing, and contamination scoring.

  5. 5

    Edge inference & cloud

    An 8-bit quantized TFLite model runs on-device; geo-tagged results sync to the companion app for heatmaps and the Microplastic Risk Index.

04 — In Action

From microscope to mobile app

The YOLOv8 pipeline localizes and classifies individual particles, while the companion app turns each capture into an actionable result in the field.
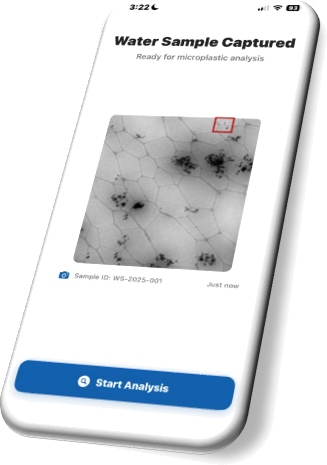
GangaDrishthi companion app showing a captured water sample ready for microplastic analysis
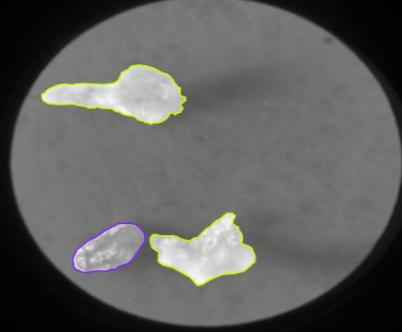
Microplastic particles segmented and outlined on a grayscale microscopy image
Fig. 2 — Particle segmentation: detected microplastics outlined by polymer class on a microscopy frame.
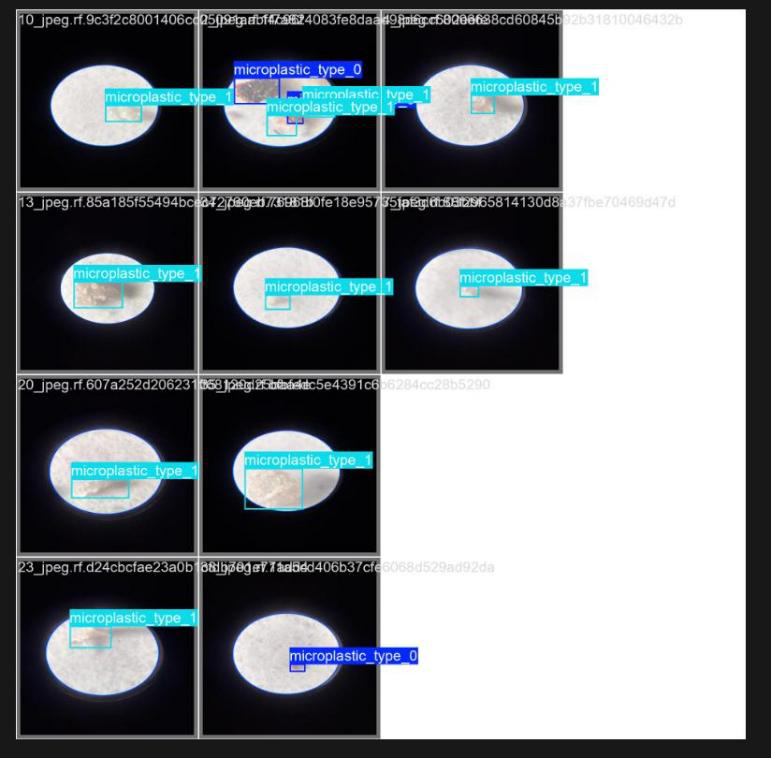
Grid of microscopy samples with YOLOv8 bounding boxes labelling microplastic types
Fig. 3 — Qualitative detection across field samples with YOLOv8 class labels.
05 — Results

Validated in the lab and the field

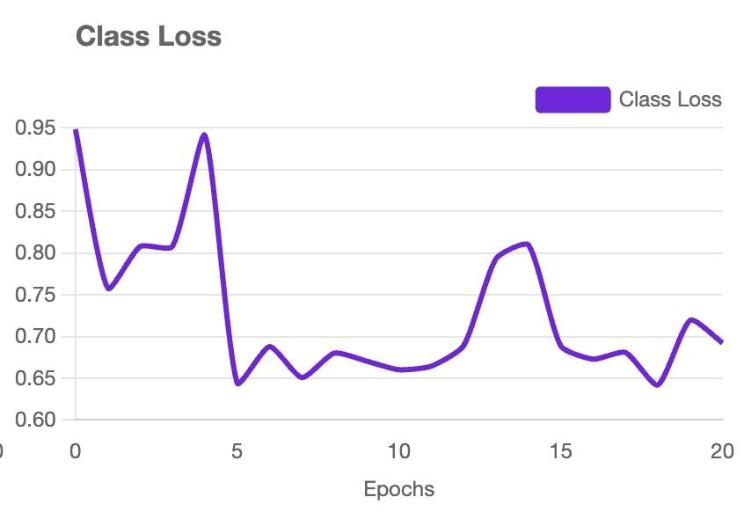
The system was evaluated across controlled laboratory tests and real-world field conditions, tracking training dynamics and detection quality over 20 epochs.
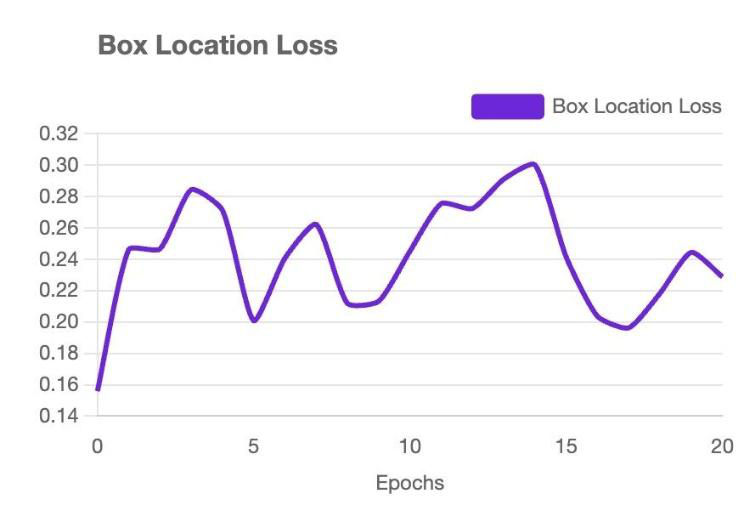
Box location loss curve across 20 training epochs
Box-location loss (Fig. 4) — high and fluctuating early, driven by irregular field particles and organic background noise, then declining to a low, stable value as localization sharpened.
Class loss curve across 20 training epochs
Class loss (Fig. 5) — dropped rapidly as clear visual differences were learned, with minor variation on visually similar polymers, settling at consistently low values.
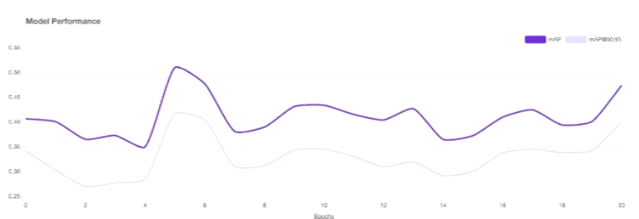
mAP and mAP@50:95 performance curves across training epochs
Model performance — mAP (Fig. 6) — mAP and mAP@50:95 oscillated through mid-training across sample complexities, then trended upward together, indicating stable, transferable detection features.
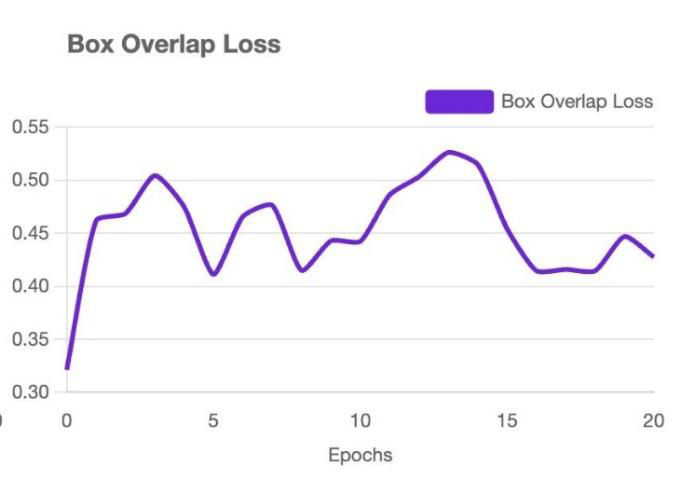
Box overlap loss curve across 20 training epochs
Box-overlap loss (Fig. 7) — after an adaptive rise, loss settled toward ~0.42 beyond epoch 15, confirming improved agreement between predicted and true particle boundaries.
“The final metrics are stable, meaning the system is ready for practical deployment — efficient and reliable across varied real-world conditions.”
06 — The Paper

Read the full research paper

Preview the complete manuscript below, download the PDF, or view it on ResearchGate.

1160.pdf · IEEE IC3ECSBHI 2026 IEEE Xplore ↗ ResearchGate ↗

Your browser can't display the embedded PDF.

Open the paper ↗
Authors

The team

India

VB

Vatsalya Bhadaurya

Computer Science & Engineering

SU

Shashwat Upadhayay

Computer Science & Engineering

VD

Vinayak Dwivedi

Electronics & Communication Engineering

YuS

Yuvraj Singh

Computer Science & Engineering

YaS

Yaduraj Singh

Computer Science & Engineering

Sh

Sharmishtha

Computer Science & Engineering

References

Selected citations

  1. M. Z. B. Zahir Arju et al., “Deep-learning enabled rapid and low-cost detection of microplastics in consumer products following on-site extraction and image processing,” RSC Adv., vol. 15, pp. 10473–10483, 2025.
  2. D. Ho and H. Feng, “Shedding Light on the Polymer's Identity: Microplastic Detection and Identification Through Nile Red Staining and Multispectral Imaging (FIMAP),” arXiv:2502.17997, 2025.
  3. J. Sarmiento, M. Anaya, and D. Tibaduiza, “Microplastic Identification Using Impedance Spectroscopy and Machine Learning Algorithms,” Int. J. Distrib. Sensor Networks, 2024.
  4. I. Ishmukhametov, S. Batasheva, and R. Fakhrullin, “Identification of Micro- and Nanoplastics Released from Medical Masks Using Hyperspectral Imaging and Deep Learning,” Analyst, vol. 147, pp. 4616–4628, 2022.
  5. K. Han et al., “Innovative Methods for Microplastic Characterization and Detection,” J. Environ. Manage., vol. 359, 2024.
  6. M. Huang et al., “Advancing Microplastic Surveillance Through Photoacoustic Imaging and Deep Learning Techniques,” J. Hazard. Mater., vol. 470, 2024.
  7. B. Shi et al., “Automatic Quantification and Classification of Microplastics in Scanning Electron Micrographs via Deep Learning,” Sci. Total Environ., vol. 825, 2022.
  8. Y. Tang et al., “Low-cost, Multispectral Machine Learning Classification of Simulated Airborne Micro/Nanoplastics,” J. Hazard. Mater., vol. 488, 2025.
  9. K. Rermborirak et al., “Low-cost Portable Microplastic Detection System Integrating Nile Red Fluorescence Staining with YOLOv8-based Deep Learning,” J. Hazard. Mater. Adv., vol. 19, 2025.